The Golden Years!
One of the many positive outcomes associated with western life is the extension of our longevity (Figure 1). However, with this benefit, comes an unfortunate increase in disease and debilitating physical pain. This is a bittersweet relationship; we get to experience our loved ones longer, travel, explore that hobby; with the likelihood of some physical ailment over time.

Figure 1 US age-adjusted mortality rates and life expectancy showing a steady increase with time
As a result of this trend, you would expect to see an increase in health expenditures as the population ages (Figure 2). This puts a tremendous burden on our medical system in addition to driving up cost. Fortunately, we have a robust and well-funded private enterprise landscape of companies and researchers that are continuously finding solutions to counter these obstacles.

Figure 2 Total US national health expenditures from 1970-2018 showing a steady increasing with time
The key to addressing two critical areas that affect this trend, cost and recovery, is implementing non-invasive techniques that minimize hospitalizations and tissue damage while getting the patient on their feet as quickly as possible.
Modern science has brought to the forefront a myriad of technological advancements in this field, all of which rely on signals that fall within the electromagnetic spectrum.
Navigation
There are three primary elements as it relates to procedures involving surgery that determine the recovery time for treatment, early diagnosis, properly locating and surgical method.
Proper diagnosis is critical in isolating and locating the general area associated with possible causes or sources of the ailment and relies heavily on case studies, lab testing, and observation. Once diagnosed, there are several options available for diagnosis confirmation and location, ultrasound, x-ray, CT scan and MRI. All of these technologies exploit the properties of high frequency waveforms.
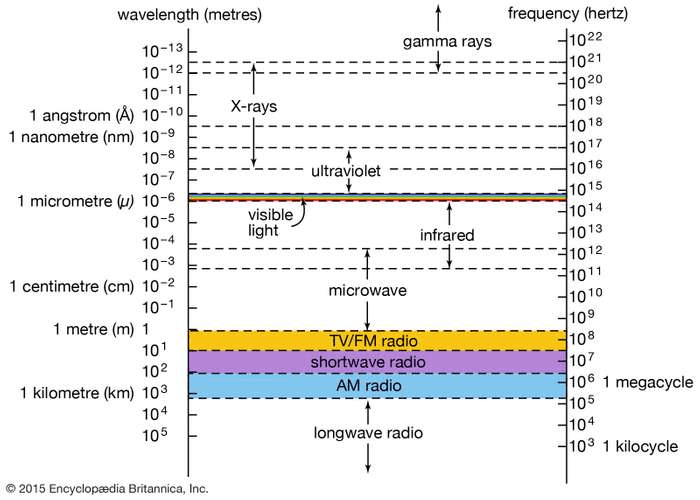
Figure 3 Frequency spectrum graph showing general application and associated wavelength relationship
Ultrasound convert electrical waveforms with various frequencies and pattens into mechanical vibrations that conduct into tissues. These waveforms or signals when conducted into the body will travel through tissue layers, then a portion of the signal reflects back at these layer boundaries. The time difference is measured between when the signal was sent and received, known as “time of flight”. Useful data and images are then extracted. Image resolution increases with frequency along with signal attenuation; frequency ranges between 2 to 18 MHz.
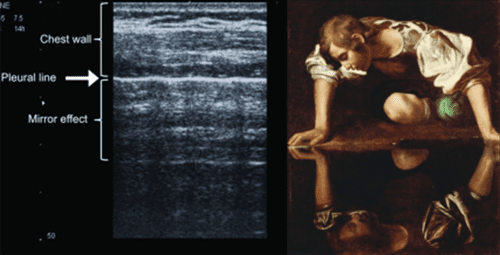
Figure 4 Ultrasound image of the chest showing the plural line which divides the image into two parts, the upper is the real image and lower is a mirror image
X-ray’s and CT scans utilize frequencies ranging from 1016 to 1020 Hz. Unlike in an ultrasound, the waveforms used in x-ray-based systems are electromagnetic which propagate through free space and pass through the bodies tissues and are then detected on the opposite side of the signal emitter. As the waveform interacts, the varying tissue density the energy is attenuated at different rates, thus creating a gradient or shadow that is processed and useful for analysis. X-rays perform this process in one direction, while CT scans repeat the process radially and longitudinally, and through complexed signal process renders a 3D image.
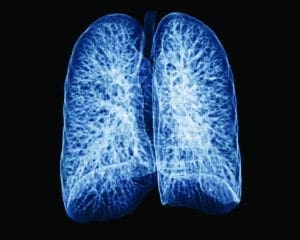
Figure 5 CT scan of healthy lungs
MRI scanning is achieved by exposing the body to an intense magnetic field 30,000 stronger than the earth. This field polarizes the water molecules in the tissue, thus magnetizing the body. A burst of RF energy between 1 to 300 MHz is focus to the image area, and this energy briefly knocks the water molecules out of alignment. When they realign in the magnetic field, they produce an RF signal which is detected by the MRI receivers. A tremendous amount of post processing is required to produce these detailed images.
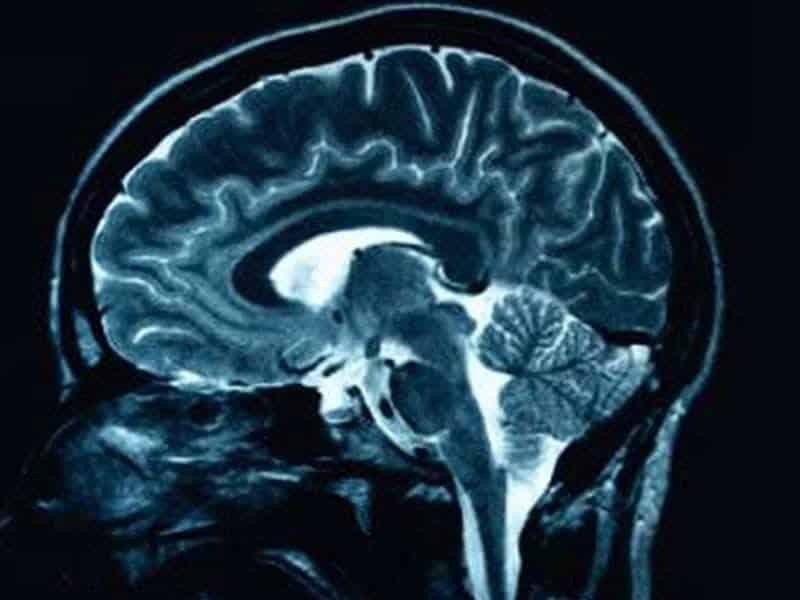
Figure 6 MRI scan of the human brain
Surgical Methods
The surgical method utilized is the prime determiner in recovery time—clearly the less invasive the technique the faster the recovery.
Ablation is a surgical technique that utilizes high frequency / high power signals by conducting them through an electrode to the unwanted or damaged tissue. This technique is primarily used in three areas, oncology (cancer and tumors), cardiology (arrhythmias) and orthopedics (pain management).
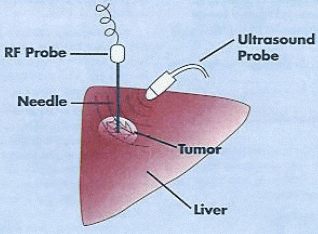
Figure 7 Ablation diagram cardiology
There are two competing electromagnet ablation technologies, radiofrequency (RFA) and microwave (MWA). The primary difference between these approaches are the operational frequencies, RFA (350-500kHz) and MWA (900-2500 MHz). With RFA, the heat generated is produced at the probe tip by completing an electrical circuit and MWA generates heat at the treatment site by molecular friction of the tissue inducted by the electromagnetic field generated by the probe, like a microwave oven.
Signal Generation
The heartbeat of all of these medical marvels is the sinusoidal waveform (sine wave). Sine waves are periodic waveforms that exist throughout nature and are used in physics to define motion of mechanical structures or objects, to electron behavior and electromagnet wave propagation. All periodic waveforms are a summation of a multitude of discrete sinusoidal waveforms with varying frequencies and amplitudes.
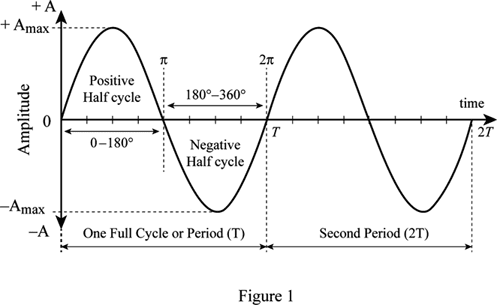
Figure 8 Sinusoidal waveform graphical representation based on sin function
In electronic circuits, there are numerous methods to generate these waveforms that alter the period (frequency), phase and amplitude, known as the oscillator. Oscillators are either “free running” or “locked” to reference oscillator or resonator.
A free running oscillator is formed by amplifying ambient thermal noise caused by electron movement that is feedback from the output of the amplifying device to its input. For a stable oscillation to exist, the gain of the amplifier has to be slightly greater than the losses through the feedback circuit and the feedback signal path needs to be in phase with the input of the amplifier, known as positive regenerative feedback.
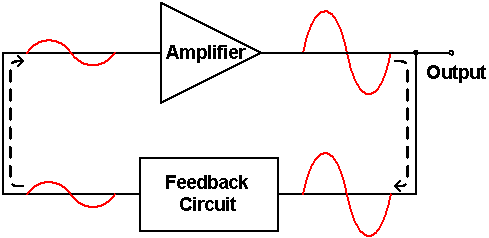
Figure 9 Simplified oscillator block diagram
Practically free running oscillators are never used without a resonator or stable reference since the frequency stability and spectral purity would be unacceptable. A resonator is essentially a filter tuned to the desired oscillator frequency that limits the feedback gain above and below the resonate frequency, its effectiveness is determined by the quality factor (Q) or loss of the circuit. Frequency stability and spectral purity increases with Q.
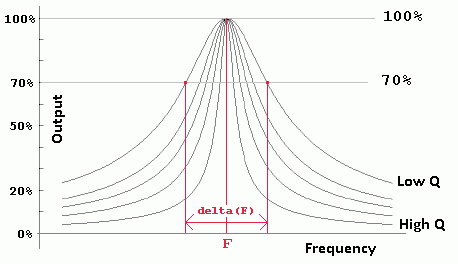
Figure 10 Resonator Q vs frequency
Oscillators that utilize frequency references are either phased locked loops (PLL’s) or synthesized. The frequency references used are typically crystals or crystal based self-contain oscillators designed for stability and spectral purity. Micro-electromechanical systems (MEMS) are also used for reference oscillators and are completely self-contained.
Crystal based oscillators utilize the piezoelectric effect associate with crystalline structures where when a voltage is applied, they produce mechanical vibrations; which in turn creates an electric signal with constant frequency with variations in the parts per billion.
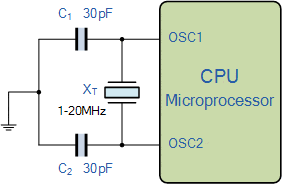
Figure 11 Crystal frequency reference used to drive PLL’s, synthesizers and clock circuitry
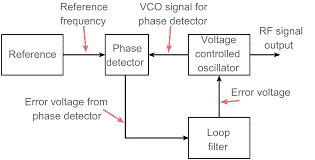
Figure 12 Phased locked loop system block diagram
PLL’s utilize a tunable element in the oscillator feedback network such as a varactor diode whose capacitance is directly proportional to the applied voltage. A sample of the oscillator frequency is divided down with a prescaler, which is essentially a series of digitally controlled flipflops. The divided down oscillator waveform is then compared to the reference by means of a phase detector that generates an error voltage that is applied to the varactor diode or tuning circuitry which in turn phase locks the local oscillator to the precise reference frequency.
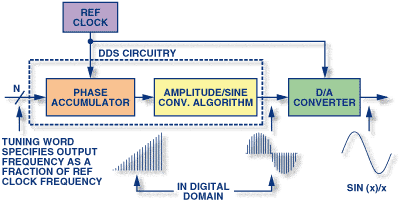
Figure 13 Direct digital synthesis system block diagram
Direct digital synthesis (DDS) produces a sinusoidal waveform by generating a time varying digital representation of the signal then performing a digital to analog conversion. The output frequency of the DDS is dependent on the frequency of the reference clock and a digital tuning word. A tuning codeword is sent to a phase accumulator that computes a phase (angle) address which outputs the amplitude value from a lookup table based on the codeword that represents the waveform. Frequency is determined by the magnitude in phase change per clock cycle. The digital pattern is then outputted to a digital to analog convert and filtered to remove quantization artifacts introduced by the reference clock.
Signal Power
Besides generation, signal power amplification is the next critical element in medical navigation and surgical systems. A typical power amplifier system consists of a pre-driver amplifier, filtering, gain control loop, driver, final PA, and output protection circuitry. The design of the signal source is critical to the safe and consistent operation of the system, specifically power control and thermal management. A key feature in the power control loop is output VSWR monitoring; VSWR is a measure of how effectively the power is being delivered to the probe. In order to properly regulate the energy applied to the treatment sight, it is imperative to know if the power is being reflecting towards the source or transferring to the load (probe). As mentioned, thermal management is fundamental; proper PA topology and device selection will determine efficiency and thermal distribution.

Figure 14 Typical system block for medical power amplifier applications
NuWaves has extensive experience in high power RF / microwave source designs and manufacturing. With several initiatives in the ablation space, NuWaves is well positioned to patriciate in this exciting and critical technology that will continue to transform the medical industry.
References
– Figure 1 – https://www.cdc.gov/nchs/data-visualization/mortality-trends/index.htm
– Figure 3 – https://www.britannica.com/science/X-ray
– Figure 4 – https://onlinelibrary.wiley.com/doi/10.7863/jum.2013.32.1.165
– Figure 5 – https://news.sutterhealth.org/2020/02/18/sutter-launches-ferrums-ai-quality-platform-to-prevent-medical-errors-fight-cancer-and-reduce-healthcare-costs/healthy-lungs-ct-scan/
– Figure 6 – https://www.echelon.health/brain-mri-scan-everything-you-need-to-know/
– Figure 7 – https://www.mayoclinic.org/tests-procedures/cardiac-ablation/about/pac-20384993
– Figure 8 – https://www.chegg.com/homework-help/definitions/sine-wave-2
– Figure 9 –http://www.cmm.gov.mo/eng/exhibition/secondfloor/MoreInfo/2_17_4_Oscillators.html
– Figure 10 – https://reviseomatic.org/help/2radio/Radio%20Tuned%20Circuits.php
– Figure 11 – https://www.electronics-tutorials.ws/oscillator/crystal.html
– Figure 12 – https://www.electronics-notes.com/articles/radio/pll-phase-locked-loop/tutorial-primer-basics.php
– Figure 13 – https://www.analog.com/en/analog-dialogue/articles/all-about-direct-digital-synthesis.html
– Figure 14 – NuWaves Engineering

