Introduction
Spectrum analyzers are a critical tool in the RF electronics lab. They provide a means of capturing and analyzing RF signals. There have been many varieties over the years, with a range of capabilities.
Through this blog, we will explore some of the changes made to spectrum analyzers over time, their basic capabilities and improvements in measurement accuracy.
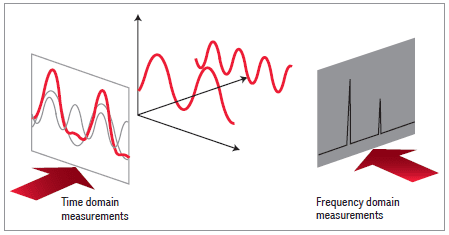
While oscilloscopes operate in the time domain, spectrum analyzers can operate in both the frequency domain and the time domain, although early models had very limited capabilities in the time domain. Another notable difference is that oscilloscopes are designed to work primarily with high input impedances of mega Ohms to reduce effects on the circuit under test, while spectrum analyzers are designed to work at low impedances of 50 or 75Ω. This allows the spectrum analyzer to measure power, whereas the oscilloscope measures voltage. The distinguishing feature of a spectrum analyzer is its high dynamic range.

As mentioned above, later spectrum analyzers can operate in both the time and frequency domains. The frequency domain is better for determining the harmonic content of a signal. Measurements in this domain tell us how much energy is present at each frequency. The time domain is better suited for measuring signals that have some time separation but overlap in frequency.
Basic spectrum analyzer types: There have been two basic types of spectrum analyzers available over the years.
Analog: Analog spectrum analyzers use the phosphor on the screen as memory, to hold the image long enough so that the user can obtain data. This usually requires multiple sweeps and/or continuous signal to trigger the spectrum analyzer. This works well enough for continuous signals, but when trying to view short duration or intermittent signals it becomes problematic.
Another downside, when in the time domain, the faster the sweep, the dimmer the display. When long sweeps are needed, fading of the display can occur. The early analyzers were limited to amplitude measurements only as well. In addition, it is difficult to save and share data. With the earlier analog spectrum analyzers, the only way to save was to photograph the screen with a film camera.
Digital: The first area in the spectrum analyzer to go digital was the display. These analyzers were first seen in the late-1970s. The thought was to digitize the trace and store it. This resolved many of the issues of the early analog spectrum analyzers, such as fading over long sweep times, and since the data remained on the screen measurements were easier to make.
After the 1980’s, other analog circuits in the spectrum analyzers were being replaced with digital equivalents. The IF section was one of these circuits. It was a mixing of old and new with the narrower resolution bandwidths being handled digitally and the wider resolution bandwidths being handled with analog filters. Today, some spectrum analyzers have fully digitized IFs and video filters allowing speeds up to 50 times faster in some resolution bandwidths.
Early analog analyzers used envelope detector to convert the IF to video. This type of detector has limited bandwidth. They work well with narrow bandwidths, but as the bandwidth gets wider you begin to lose phase resolution. Today’s digital spectrum analyzers do not have an analog envelope detector and so do not suffer from phase resolution loss.
The latest digital analyzers can perform both amplitude and phase measurements. Fast Fourier transformations (FFT) allow the movement between the frequency domain and the time domain. It should be noted when performing Fast Fourier Transforms, it is necessary to maintain phase relationships when moving from the one domain to the other.
Beyond that, digital filters do not have to be aligned; they remain stable across a range of temperatures, and they are not subject to aging – all of which enables them to achieve greater bandwidth accuracy. Because digital filters do not have to be implemented in hardware, many different filter types can be made available on a spectrum analyzer.
Bandwidth Notes
- A change in resolution has a dramatic effect on sweep time. Narrower settings produce much slower sweep speeds. Remember, doubling your resolution will increase your sweep time by much more than two times.
- Digital filters have dramatically improved bandwidth and bandwidth selectivity.
- Some analyzers employ a hybrid approach, using analog filters for the wider bandwidths and digital filters for bandwidths of 300 Hz and below.
- Many newer spectrum analyzers implement all bandwidth-filtering digitally. This can improve sweep times 2 to 4-fold. The newest models can be 50 times faster in some bandwidths.
- Use a narrow bandwidth setting when measuring low-level signals: it lowers the displayed average noise level of the spectrum analyzer and increases the dynamic range. This will improve measurement sensitivity. Note: you must pay attention to the amount of bandwidth required by the signal being measured, too little on a spread spectrum signal will produce inaccurate measurements.
- For modulated signals use a resolution bandwidth wide enough to include the sidebands or your power measurement will not be inaccurate.
- With digital processing, and digital bandwidth filtering, narrow RBW sweeps can be as much as fifty times faster.
- Resolution affects sweep time. Sweep time directly affects how long it takes to complete a measurement and therefore how long it takes to complete a project.
- Sweep time is dependent on the resolution bandwidth (RBW) filter, frequency span, and the design of the spectrum analyzer.
Local Oscillator (LO) Notes
- Early spectrum analyzer LOs were only stable enough to support bandwidths of 1kHz or greater. Some newer analyzers can support bandwidths of 0.25 Hz.
- The LO produces phase noise that cause sidebands to appear. The more stable the LO, the less phase noise it will produce. Note, we can see the inherent phase noise of a spectrum analyzer only in the narrower resolution filters, when it obscures the lower skirts of these filters. The use of the digital filters does not change this effect. For wider filters, the phase noise is hidden under the filter skirt.
- The instability and residual FM of the LOs in an analyzer, particularly the first LO, often determine the minimum usable resolution bandwidth.
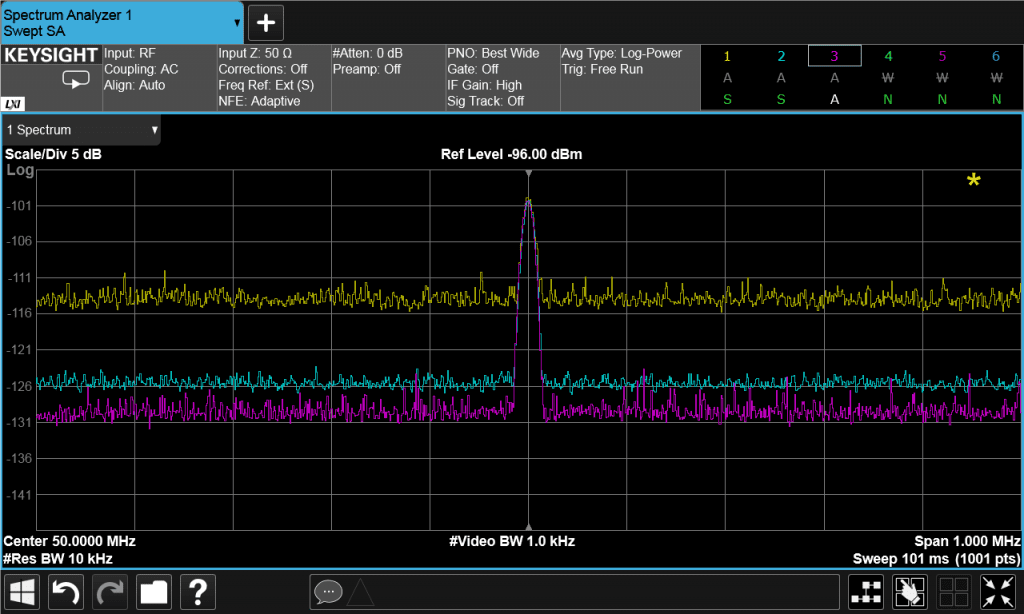
Video filtering, smoothing or averaging: Discerning signals close to the noise can be difficult. Spectrum analyzers display their own internal noise in addition to the signal of interest. To decrease the noise, you can use smoothing or averaging. The effect is most noticeable in measuring noise, particularly when you use a wide-resolution bandwidth. Note, the video filter does not affect any part of the trace that is already smooth.
Trace averaging: Another choice for smoothing the display is trace averaging. It requires at least two sweeps, more is better. A signal with a spectrum that changes with time can yield a different average on each sweep when we use video filtering. However, if we choose trace averaging over many sweeps, we will get a value much closer to the true average.
Time gating: Allows you to separate signals operating at the same frequency but are separated by time.
Sensitivity and Noise: It is often necessary to measure low-level signals. The noise generated in the spectrum analyzer can make these measurements difficult. To reduce the effects of this internally generated noise, and produce the best signal to noise ratio, perform the following:
- Select the minimum input attenuation without over driving the mixer (improves signal to noise.)
- Choose minimum resolution bandwidth (improves signal to noise but increases sweep time.)
- Select minimum video bandwidth to see a signal close to the noise level (improves signal to noise but increases sweep time.)
- Placing a low noise preamplifier in front of the spectrum analyzer can lower the system noise figure. This can be less than that of the spectrum analyzer noise figure by itself.

Dynamic Range: Dynamic Range is the ratio, expressed in dB, of the largest to the smallest signals simultaneously present at the input of the spectrum analyzer that allows measurement of the smaller signal to a given degree of uncertainty.
Distortion Products: Use an attenuator test to determine where distortion is coming from in the measurement. Change the spectrum analyzers’ input attenuator. If the displayed value of the distortion components remains the same, the components are part of the input signal. If the displayed value changes, the distortion components are generated internally or are the sum of external and internally generated signals. Continue changing the attenuator until the displayed distortion does not change and then complete the measurement.
RF Attenuator: The first part of our analyzer is the RF input attenuator. Its purpose is to ensure the signal enters the mixer at the optimum level to prevent overload, gain compression and distortion. Because attenuation is a protective circuit for the analyzer, it is usually set automatically, based on the reference level. However, manual selection of attenuation is also available.
Uncertainty Factors
- Input connector (mismatch)
- RF input attenuator
- Mixer and input filter (flatness)
- IF gain/attenuation (reference level)
- RBW filters
- Display scale fidelity
- Calibrator
Minimizing Uncertainty:
- Know the specifications for your spectrum analyzer.
- If it’s not necessary to change the controls on the spectrum analyzer then don’t, all uncertainties associated with changing these controls will drop out.
Uncertainties that a Digital IF Minimizes:
- IF gain uncertainty (Reference Level).
- Display scale fidelity.
- RBW switching uncertainty.
- Amplitude uncertainty examples, Frequency accuracy.
Tip: Below is a comparison between the 8566B-002 and the ESA-E series spectrum analyzers. Neither is in production anymore, but both are very affordable. the most notable difference between the two is sweep time. Also, of note, for those who use these in an ATE, is the speed difference when moving data in machine units vs moving it in ASCll. Of course, the newest spectrum analyzers are far faster.


References
Keysight:
5952-0292 Spectrum Analysis Basics
5965-7009 Signal analysis Measurement Fundamentals
5968-3411 Optimizing Spectrum Analyzer Measurement speed
5968-3658E ESA Series Spectrum Analyzers
5968-4545 Optimizing RF and Microwave Spectrum analyzer Dynamic Range
E4401-90482 Measurement Guide and Programming
E4407B Signal Measurement Guide
Rowde & Schwarz:
1EF78_2E – Harmonics, Measurement of Harmonics using spectrum analyzers
003.008.029.13 – Rowde & Schwarz spectrum analyzer fundamentals primer
Tektronix:
37W_17249_6_Fundamentals_of_Real-Time_Spectrum_Analysis1 (3)
37W_17249_6_Fundamentals_of_Real-Time_Spectrum_Analysis1 (1)


